A production data race in the query service, and why the obvious fix was the wrong one.
Part 1 was about how the engine runs a query: operators wired into a tree, Parallel cloning the cheap per-document work at the bottom, and blocking operators funnelling it back into a single thread at the top. I ended it saying I now understood why go someFunc() doesn't wait for anything, and that the story about what happens when you get that wrong deserved its own post.
This is that post, though not in the way I meant it. It's about what happens when something reaches into one of those trees while it's still running.
There's a particular kind of bug that only shows up when you look at the system. Not when you use it. When you watch it. The act of observation is the thing that breaks it.
That's what this post is about. A monitoring page in a database console that, roughly one time in nine, killed the very query that was drawing it.
The bug is interesting. But the more interesting part, to me, was the fix, because the first fix I wrote was airtight, provably correct, and got thrown away.
First: nothing crashed
The first thing on the alert was wrong.
The monitoring API reported event_id 1024, labelled "Service crashed". That label is wrong, and it's worth settling before anything else, because a log line saying the service died sends you looking for entirely different things than a log line saying one query was aborted.
Event 1024 is emitted by the query service's own panic-recovery handler, execution.(*Context).Recover, for any request-level panic it catches. The handler aborts the one offending request and execution continues. It does not mean the process died.
Four independent things confirmed nothing had crashed:
Uptime never reset. The five-minute stats samples ran 1761h31m → 1761h46m → 1761h51m → … → 1762h6m, monotonically increasing straight through all three panics. A process restart zeroes that counter. It never zeroed.
The supervisor logged no restart. Couchbase runs a babysitter process whose entire job is restarting the query engine if it dies, and logging when it does. Last restart: 73 days earlier. That number matches the ~1762h uptime exactly. Two independent sources agreeing.
No crash dump. A real process death triggers an FFDC (First Failure Data Capture) dump, a black box recorder. None was produced at any of the three timestamps.
Each event affected exactly one request. errorCount 1, code 5001, key execution.panic, state aborted. Singular. Contained.
Every application query on the node completed normally. The only casualty, each time, was the monitoring query itself.
This is worth dwelling on because it is the difference between "the database is unstable" and "one diagnostic page glitched." Same log line. Wildly different investigations.
What actually breaks
The one field this all hangs on
Part 1 covered what the execution tree is: operators wired together, data pushed through. The only thing you need on top of that here is where the tree actually lives.
Each request holds a pointer to the root of its own tree, in a field named timings:
type BaseRequest struct {
    timings execution.Operator   // ← root of this request's execution tree
}
The name is a historical artifact. It's called timings because its main use is reporting how long each operator took, but it's the whole tree, not just numbers. That mismatch between what a field is named and what it actually holds turns out to matter, because a pointer to "some timing stats" feels a lot safer to pass around than a pointer to a live, running machine.
The recycling
Allocating operators costs memory and creates garbage for the GC. So Couchbase recycles them. When a query finishes, Done() runs:
func (this *Filter) Done() {
    this.baseDone()
    if this.isComplete() {
        this.plan = nil                 // wipe the fields
        _FILTER_OP_POOL.Put(this)       // put it on a shelf for the NEXT query
    }
}
Two things happen here, and the second one matters more than it looks:
- The operator's fields get nilled.
- The object is handed to a different query, which will refill it with its data.
This is standard sync.Pool practice and it's correct. The memory isn't freed. It's re-tenanted. Think of a canteen tray: when you're done, you don't throw it away, you wipe it and put it back on the stack. The next person gets that exact tray. Same physical object, different contents.
The observation problem
Couchbase exposes a virtual table:
SELECT * FROM system:active_requests;
Ask it for meta().plan and you also get each running query's execution tree, rendered as JSON:
SELECT active_requests.*, meta().plan FROM system:active_requests;
Read that carefully. To produce meta().plan, your query has to reach into someone else's live, currently-running execution tree, on a different goroutine, and serialize it. You are reading another thread's private machinery while it runs.
The Web Console's Query Monitor → Active Requests page runs exactly this query, on a polling loop.
The lazy pointer
Here's the old code, in datastore/system/system_keyspace_actives.go:
timings := request.GetTimings()                 // raw pointer to their live tree
if timings != nil {
    meta["plan"] = value.ApplyDurationStyleToValue(
        context.DurationStyle(),
        value.NewMarshalledValue(timings))      // ← store the POINTER, marshal LATER
    optEstimates := request.Output().FmtOptimizerEstimates(timings)
}
Two things here are individually reasonable and jointly fatal.
GetTimings() was a naked field read. No lock, no copy, no snapshot:
func (this *BaseRequest) GetTimings() execution.Operator {
    return this.timings
}
You get a raw pointer to a tree owned by another goroutine, which is free to destroy it one nanosecond later.
NewMarshalledValue is lazy. This is the crux. It does not produce JSON. It creates a box that says "here's a pointer, convert it to JSON later, when someone actually asks":
type marshalledValue struct {
    raw        interface{}   // ← the live operator tree parks here
    marshalled Value
}

func (this *marshalledValue) unwrap() Value {          // called MUCH later
    if this.raw != nil {
        marshalled, err := json.Marshal(this.raw)      // the real work, finally
        ...
The laziness was deliberate and good. It exists so you don't pay to marshal plans for rows that get filtered out and never displayed. Perfectly sensible optimization. Catastrophic when the thing you're deferring work on is about to be destroyed.
It's worth being concrete about what that optimization is buying, because it comes back later.
Marshalling an operator tree is not cheap. It's a recursive walk over every node, and each node builds a map, formats its timing fields, and allocates into a byte buffer. A non-trivial query has dozens of operators. Now consider what a scan of system:active_requests looks like on a busy node: 2–12 requests in flight at any moment, and the Query Monitor page re-polling continuously. Eager marshalling means serializing every one of those trees, in full, on every single poll.
And you'd pay it whether or not anyone wants the result. meta().plan is only rendered if the query actually projects it, but a fetch doesn't know that. So SELECT * FROM system:active_requests (no plan projection at all) would still marshal every tree it touched, and throw all of it away. Same for any row eliminated by a WHERE clause further up the pipeline: full cost paid, output discarded.
That's precisely the waste the lazy wrapper was written to eliminate. Any fix that marshals eagerly is silently reverting that optimization. That's fine if you've decided the trade is worth it, and not fine if you didn't notice you were making it.
"Later" arrives when the row reaches httpRequest.Result() and gets written to the HTTP response. Measured gap in the crash reports: 1 to 5 milliseconds. A modern CPU does millions of things in 5ms.
The collision
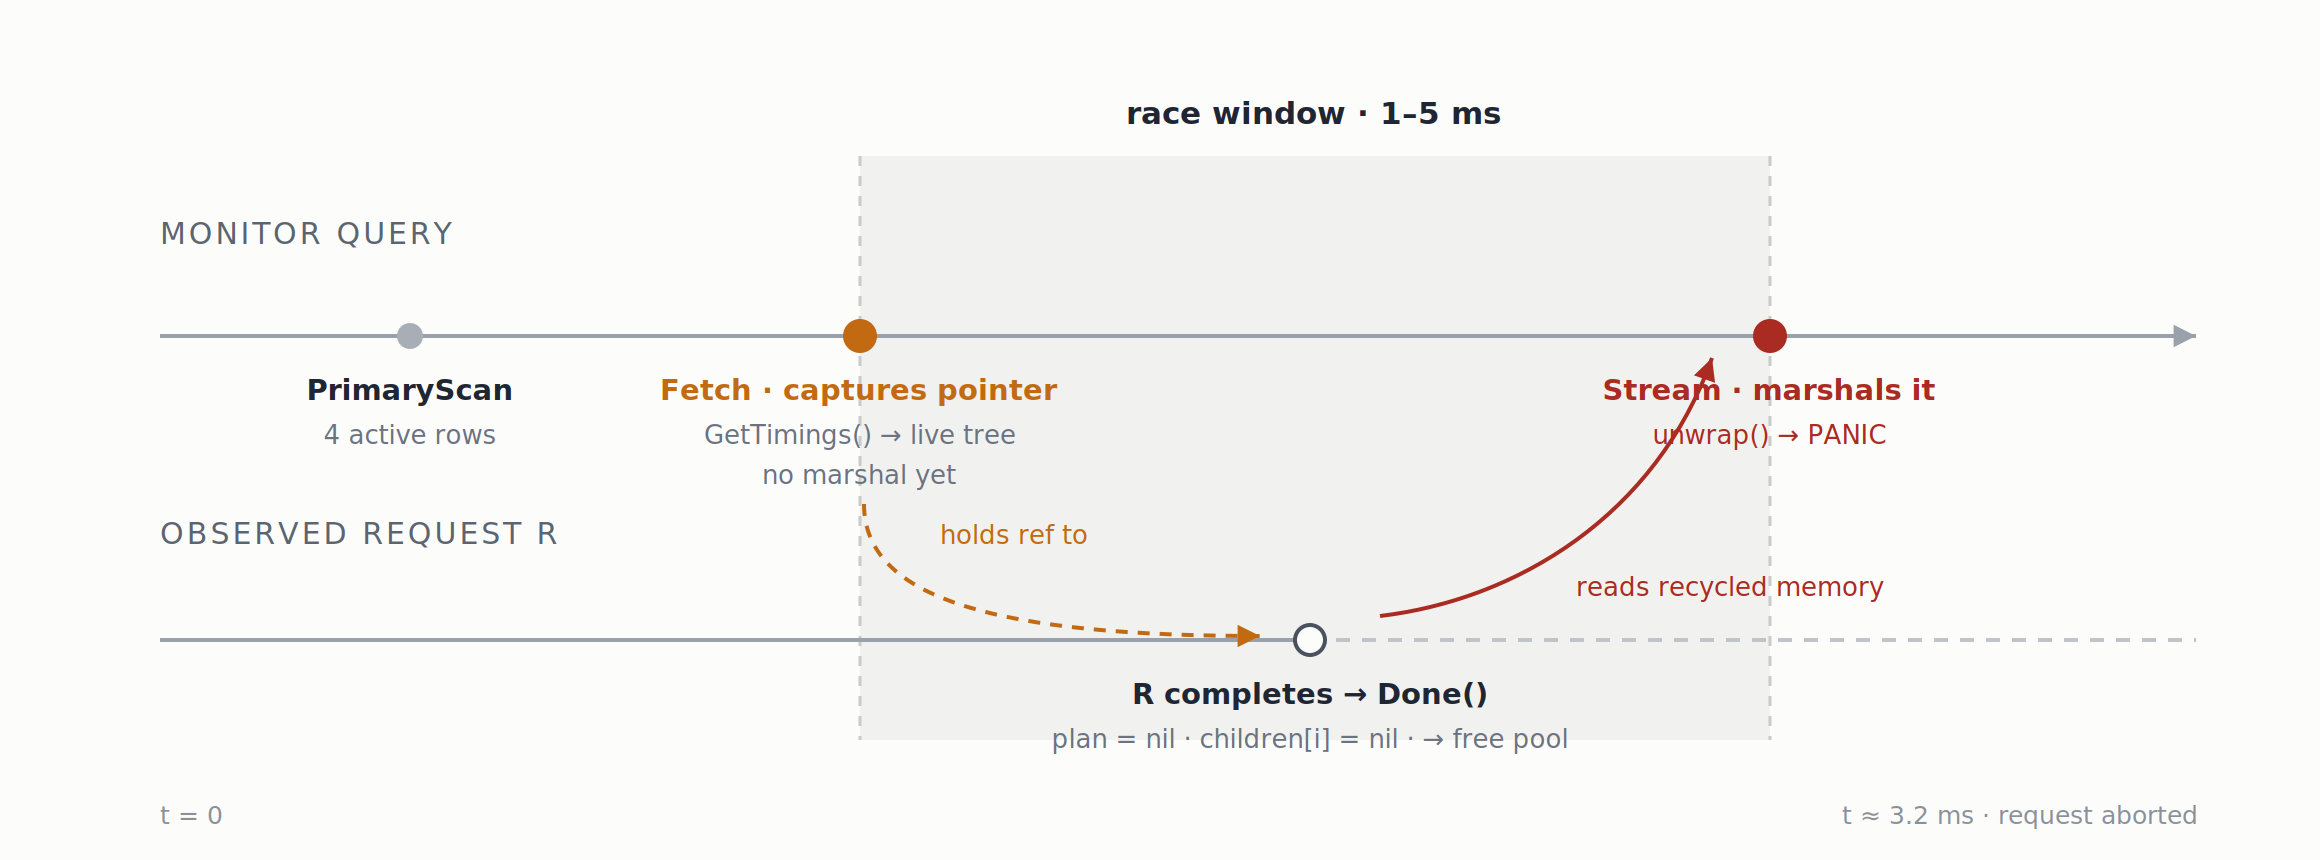
The monitor query captures a raw pointer at fetch time but dereferences it at output time. Request R's teardown lands in between, nilling the very fields the marshaller is about to read, and handing the operators to other requests via the free pools.
The stack trace confirms it to the byte:
execution.(*Filter).MarshalJSON(0x30c74a0?)
    .../execution/filter.go:114 +0x1f
+0x1f is 31 bytes into the function: the prologue plus exactly one field load. Line 114 is:
r := this.plan.MarshalBase(...)
this.plan is nil, because Done() nilled it. Reading a field off nil is a nil pointer dereference. That's the whole crash.
Why we know it's a race and not a logic bug
Three properties of the event history rule out any deterministic defect:
1. The same query mostly works. The logs held 28 executions of the identical statement. Exactly 3 aborted. The other 25 returned normally. An ~11% failure rate on an identical statement against identical code is a timing window, not a logic error.
2. The crashing operator is essentially random. Across all 38 events the fault landed in whichever node the marshaller happened to reach after that node's teardown. Fifteen different operator types so far, always at the same this.plan field load:
| Crashing frame | Events | Crashing frame | Events |
|---|---|---|---|
Stream.MarshalJSON |
6 | InitialGroup.MarshalJSON |
2 |
InitialProject.MarshalJSON |
4 | Alias · IntermediateGroup |
1 each |
Set.MarshalJSON |
3 | Fetch · IndexScan3 |
1 each |
Limit.MarshalJSON |
3 | Unnest · FinalGroup |
1 each |
Filter.MarshalJSON |
3 | ValueScan · Sequence |
1 each |
UnionAll.MarshalJSON |
2 | non-marshal paths | 7 |
3. It fails partway through streaming. Each panic hit while emitting the row belonging to the request that finished mid-stream, never at a fixed position. 1 row emitted, then 0, then 1. Elapsed times of 5.11ms, 5.55ms, 3.21ms.
Why this node and not others: it sustained ~700–875 req/s with a 2.6ms mean request time. That means 2–12 requests are in flight and completing continuously while the monitor query holds pointers to all of them. The window isn't wider here. It's just being rolled against far more often.
The second, quieter fault site
Look at the old code once more:
optEstimates := request.Output().FmtOptimizerEstimates(timings)
This one walks the tree immediately, not lazily. Smaller window, but it runs on every fetch, whether or not you asked for meta().plan. Two of the 38 events came from this path, faulting in Authorize.PlanOp on a nil receiver.
Which means the obvious workaround, "just don't select meta().plan", narrows exposure by about 94% but was never actually safe.
The commit that undid the fix
This bug had been fixed before. In 2023. And then unfixed, nine days later.
The first commit fixed this exact panic by marshalling eagerly at fetch time and wrapping the resulting bytes:
t := request.GetFmtTimings()
if t == nil { t, _ = json.Marshal(timings) }   // eager
... value.NewMarshalledValue(t)                // wraps []byte, not the live tree
Correct instinct. But there was a bug in the bug fix: json.Marshal on a []byte base64-encodes it. So instead of a nested plan object, users saw:
"plan": "eyIjb3BlcmF0b3IiOiJBdXRob3JpemUi..."
The second commit, nine days later, fixed that, by putting the live pointer back:
- t := request.GetFmtTimings()
- if t == nil { t, _ = json.Marshal(timings) }
- ... value.NewMarshalledValue(t)
+ ... value.NewMarshalledValue(timings)   // back to the live tree
A display-formatting fix silently reintroduced a use-after-recycle race. Nobody did anything wrong in isolation. The second commit's title is about a rendering problem; it doesn't mention concurrency at all. The race came back as a side effect, and nothing caught it for two and a half years.
There's a lesson in here about revert hygiene that I don't think is fully captured by "write more tests." The reverting commit was correct about the thing it was fixing. What was missing was any signal, anywhere in the code or the review, that the thing being reverted was load-bearing for something else entirely.
The fix I wrote first
The obvious fix is a lock. If a reader is reading the tree, the destroyer must wait. If the destroyer got there first, the reader must see that the tree is gone and back off cleanly.
Go's sync.RWMutex is exactly the right shape for this:
RLock(), readers |
Lock(), writer |
|
|---|---|---|
| How many at once? | Many | Exactly one |
| Blocks other readers? | No | Yes |
| Blocks the writer? | Yes | Yes |
Many monitor queries can safely read one tree simultaneously; a destroyer must have it entirely to itself. The rule that does all the work: Lock() cannot succeed while even one RLock() is outstanding.
The accessor
func (this *BaseRequest) WithTimings(f func(execution.Operator)) bool {
    this.timingsLock.RLock()
    defer this.timingsLock.RUnlock()
    if this.timings == nil {
        return false
    }
    f(this.timings)
    return true
}
The design decision worth explaining here: it takes a callback rather than returning the tree. Why not just return it?
tree := request.GetTimingsSafely()   // lock... and unlock when?
// ← the lock is already released here. The tree can die on this very line.
Returning the tree means releasing the lock before the caller uses it, which is useless. Passing a callback means the lock is held across the caller's entire body. The nil check being inside the same critical section isn't incidental. It's the whole safety argument.
The teardown
this.timingsLock.Lock()
timings := this.timings      // 1. keep a private copy
this.timings = nil           // 2. cut the public link
this.timingsLock.Unlock()

this.done(timings)           // 3. NOW destroy it, outside the lock
Notice that the destruction happens outside the lock. This looks wrong at first glance and is the single most important decision in the design.
The deadlock I wrote and then found
My first version held the write lock across the whole teardown:
this.timingsLock.Lock()
this.done()                 // ← this can block
this.timingsLock.Unlock()
done() cascades Done() down the tree, and for any operator still running, it waits:
case _RUNNING, _HALTING, _STOPPING:
    this.activeCond.Wait()      // sleep until that operator finishes
Here's the trap. A monitor query is itself a request. It appears in its own system:active_requests output. So it can reach its own row and call WithTimings on itself. Now:
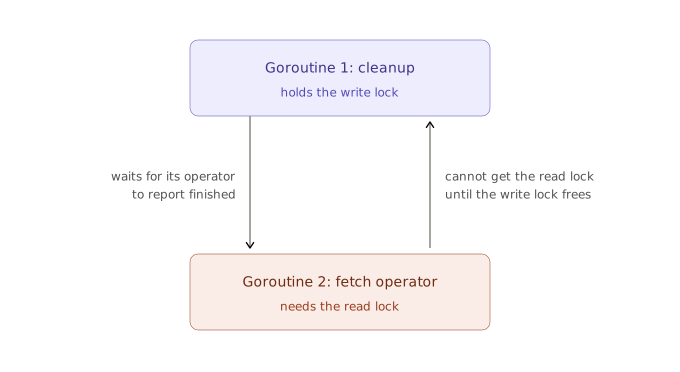
The version I wrote first, holding the write lock across the whole teardown. Both goroutines belong to the same request.
Shrinking the critical section to a two-instruction pointer swap, which can never block on anything, makes this structurally impossible. The lock is held for nanoseconds, never across a Wait().
The challenge from review
At a dev sync, a senior engineer pushed back with a timeline:
T1. Query 1 finishes, acquires the write lock, cleans up the execution tree. Operators cleaned and pooled. T2. The active-requests routine acquires the read lock and attempts to marshal this tree. Panic.
This is exactly the right question to ask, and working through the answer is what made me confident in the design.
For a reader to crash it must (a) obtain the read lock, (b) observe timings as non-nil, and (c) be handed a pointer that's freed while it works. RWMutex permits exactly two orderings:
Ordering A, reader first:
Reader:  RLock() ✓ → sees non-nil → marshalling...
Writer:  Lock() ......... BLOCKED .........
Reader:  ...done → RUnlock()
Writer:  Lock() ✓ → timings = nil → Unlock() → done(timings)
The writer physically could not begin destroying anything until the reader finished.
Ordering B, writer first:
Writer:  Lock() ✓ → timings = nil → Unlock()
Reader:  RLock() ✓ → sees nil → return false. Never touches the tree.
Writer:  done(timings)   ← destroying, nobody looking
The reader was turned away before it received a pointer.
There is no third ordering. The nil check and the pointer handover happen inside the same protected section, so a reader can never observe "alive" and then have it die underneath them.
The lock doesn't protect the tree. It protects the decision to hand the tree out. Narrower, cheaper, sufficient.
And the challenge paid for itself directly: re-auditing every access to timings turned up that SetTimings(), the initial write at request startup, was still unguarded. A request becomes visible in system:active_requests before SetTimings() runs, so a monitor query could read that field mid-write. It can't cause this crash, but an unsynchronized concurrent read/write of the same word is undefined behaviour in Go and would trip -race. The question found a real second bug, even though its stated scenario was already safe.
Why that fix got thrown away
The lock version was correct. It closed the race completely, not just narrowed it. It also eliminated a quieter failure mode I'll come back to.
It was still the wrong call.
The reasoning, from the engineer who owns this code, was four words:
"no contention, no lock, this is not critical"
Unpack that. meta().plan is best-effort telemetry. No user data depends on it. No correctness guarantee rests on it. It's a number on a diagnostic page that a human glances at occasionally.
The lock approach adds synchronization to the request completion path. Every single request on the node, hundreds per second, forever, pays a small cost at shutdown, so that a rare monitoring query can be guaranteed a complete answer instead of an occasionally-missing one.
That's a bad trade. You are taxing the hot path to protect the cold path.
There's a second cost that's easy to miss. The lock approach forces eager marshalling. That's not incidental, it's structural. The whole point of holding the read lock across the caller's work is that all the dangerous work has to happen inside the protected region. You can't hold a lock and then hand a pointer out to be used later; that's the original bug with extra steps. So the marshal has to happen at fetch time, which means undoing that optimization and paying the full serialization cost for every active request on every poll, including the ones that never asked for a plan.
So the lock version isn't just "the safe fix plus a small mutex." It's the safe fix, plus a mutex on the completion path, plus the reintroduction of a performance regression that someone had already deliberately fixed. Three costs, all permanent, all borne by requests that have nothing to do with the monitoring page.
The alternative: let the crash happen, catch it, and return null for that one field. Don't prevent the race. Contain the damage.
I want to be honest that I didn't reach for this first. My instinct was "there's a data race, races are bugs, eliminate the race." That instinct is usually right and it was wrong here, because it optimizes for a property (no race) rather than an outcome (nobody's query dies). The correct question wasn't "how do I make this safe?" It was "what does failure actually cost, and what am I willing to pay to avoid it?"
The Go you need for the real fix
Three language features do all the work. If you already know defer, recover, named returns, and json.Marshaler, skip ahead.
panic and recover
A panic is Go's "something went catastrophically wrong": a nil dereference, an out-of-range index. Left alone it unwinds the stack and kills the program.
recover() catches it and stops the unwind. It only works inside a defer.
defer
defer means "run this when the function exits, however it exits." Normal return, early return, or panic:
func example() {
    defer fmt.Println("always runs")
    fmt.Println("first")
    panic("boom")
    // "always runs" still prints
}
That's precisely why recover() lives in a defer: deferred code is the only code that still runs during a panic.
Named return values, the crucial bit
Normally:
func f() ([]byte, error) {
    return data, nil
}
But you can name them:
func f() (b []byte, err error) {
    //     ^^^^^^^^^^^^^^^^^^ these are real variables, alive from function entry
    b = data
    return          // returns whatever b and err currently hold
}
Why this matters enormously: a deferred function can reassign those named variables, and the caller sees the change. This is the only mechanism by which recover() can turn a crash into a clean return value:
func f() (b []byte, err error) {
    defer func() {
        if e := recover(); e != nil {
            b = nil            // ← rewriting the return values
            err = someError    // ← mid-panic
        }
    }()
    return dangerousThing()    // if this panics...
}                              // ...caller gets (nil, someError), not a crash
Without named returns this is impossible. Unnamed return values only exist at the instant a return statement completes, and if the function panicked, no return ever completed, so there's nothing to modify. Named returns exist as real, addressable variables from the moment the function starts, regardless of how chaotically it ends.
json.Marshaler
An interface in Go is a contract: any type with these methods qualifies. json.Marshaler is a one-method contract:
type Marshaler interface {
    MarshalJSON() ([]byte, error)
}
The rule that makes the whole fix work: when json.Marshal(x) runs, it first checks whether x has a MarshalJSON() method. If it does, it calls your method and uses whatever you return, instead of inspecting the object's fields itself.
That's how Filter.MarshalJSON ended up in the crash stack in the first place: those operators define their own. And it's the hook the fix uses.
The fix that shipped
Change 1: a wrapper wearing a seatbelt
type requestPlan struct {
    id      string
    timings execution.Operator
}

func (this *requestPlan) MarshalJSON() (b []byte, err error) {

    // the tree can be cleaned up while it is being walked: returning an error leaves the
    // caller with a null plan, which beats aborting the request that is doing the reporting
    defer func() {
        if e := recover(); e != nil {
            b = nil
            err = errors.NewError(nil, fmt.Sprintf("execution tree cleaned up whilst marshalling: %v", e))
            logPlanCleanedUp(this.id, e)
        }
    }()

    return json.Marshal(this.timings)
}
As a story: a tiny box holding the tree pointer plus an ID for logging. It has a MarshalJSON() method, so it satisfies json.Marshaler and Go's encoder will call this instead of poking at the struct's fields. Inside, it does the dangerous thing. But defer + recover() stand guard, and named returns let the deferred function rewrite the outputs to (nil, error).
The crash still happens. It just stops here, inside a five-line function, instead of climbing the stack and killing the query.
Change 2: don't fail silently
func logPlanCleanedUp(id string, e interface{}) {
    logging.Debuga(func() string {
        return fmt.Sprintf("Execution tree of request %v cleaned up whilst gathering its plan: %v", id, e)
    })
}
Small but not optional. Swallowing errors silently is how bugs hide for years. See the 2023 revert above.
Two details worth stealing: Debuga takes a function rather than a string, so if debug logging is off you never pay to build the message. And it's Debug, not Warn, deliberately, because this is now an expected, handled condition. On a busy node it could fire often, and Warn-level would be log spam that trains people to ignore the log.
Change 3: the front door
func RequestPlan(request Request) (plan value.Value, estimates map[string]interface{}) {
    timings := request.GetTimings()
    if timings == nil {
        return nil, nil
    }

    id := request.Id().String()
    defer func() {
        if e := recover(); e != nil {
            plan = nil
            estimates = nil
            logPlanCleanedUp(id, e)
        }
    }()

    estimates = request.Output().FmtOptimizerEstimates(timings)
    return value.NewMarshalledValue(&requestPlan{id: id, timings: timings}), estimates
}
Note the second, separate recover(). There's a real reason for it. The two crash sites need different handling:
| When does it touch the tree? | Caught by | |
|---|---|---|
| The plan marshal | Later (lazy) | requestPlan.MarshalJSON's recover |
FmtOptimizerEstimates |
Right now (eager) | RequestPlan's own recover |
FmtOptimizerEstimates walks the tree on this line, so a lazy safety net does nothing for it. It needs a guard right here. That's the fetch-time signature, the one that fires even when you never asked for the plan.
And look at the last line: we're still lazy. Still NewMarshalledValue. The box still defers its work. But what's inside the box is no longer a naked pointer. It's a wrapper that knows how to fail safely. That's what backing out the mutex bought: laziness kept, crash contained.
This is the part I'd underline. The lock approach and the eager marshal were a package deal. You couldn't have one without the other. Dropping the lock is what made it possible to leave NewMarshalledValue exactly where it was, still deferring, still skipping the work for rows nobody looks at. The lazy path survives untouched. The fix costs a wrapper struct and two defer blocks, and nothing else in the system pays anything.
Change 4: the call sites
Before:
timings := request.GetTimings()
if timings != nil {
    meta["plan"] = value.ApplyDurationStyleToValue(context.DurationStyle(),
        value.NewMarshalledValue(timings))          // ← naked pointer, no net
    optEstimates := request.Output().FmtOptimizerEstimates(timings)   // ← unguarded
    if optEstimates != nil {
        meta["optimizerEstimates"] = value.NewValue(optEstimates)
    }
}
After:
plan, optEstimates := server.RequestPlan(request)
if plan != nil {
    meta["plan"] = value.ApplyDurationStyleToValue(context.DurationStyle(), plan)
}
if optEstimates != nil {
    meta["optimizerEstimates"] = value.NewValue(optEstimates)
}
Both dangerous operations behind one guarded call. The admin REST endpoint got identical treatment: same bug, same fix.
How it flows at runtime
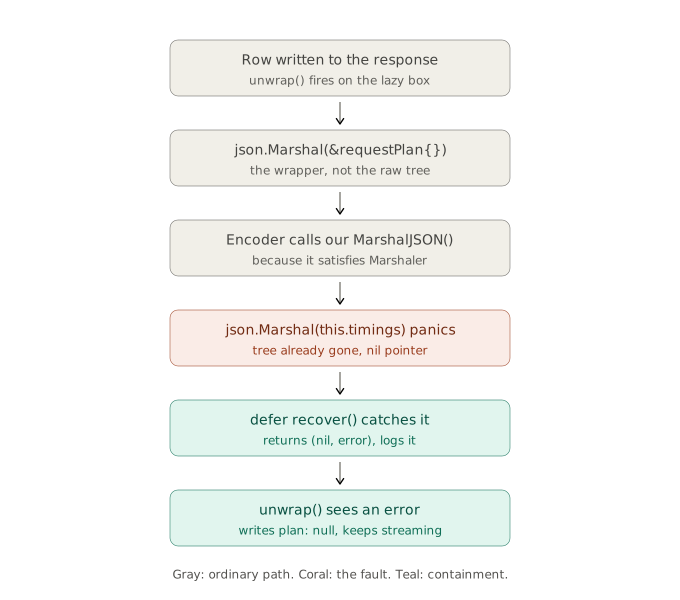
The last step is the elegant part, and it required zero changes:
marshalled, err := json.Marshal(this.raw)
if err != nil {
    this.marshalled = NewNullValue()      // ← already here, all along
} else {
    this.marshalled = NewParsedValue(marshalled, true)
}
That error path existed in the codebase the entire time. It already produced a null. It just never fired, because nothing upstream ever converted a panic into an error. The whole fix, at the deepest level, was making a crash arrive in a shape the existing code already knew how to handle.
Result: "plan": null on one row. The query keeps streaming everything else. Nobody's request dies.
The 2023 trap, avoided
Remember why the second commit reverted the first: base64 garbage, because json.Marshal on a []byte encodes it.
This design sidesteps that for free. raw is a struct with a MarshalJSON method, not a []byte. The encoder calls our method and gets real JSON back, a proper nested object. Both the crash and the display bug stay fixed, and neither fix is standing on the other's toes.
What this does not fix
This part matters more than the parts that work.
1. recover() catches crashes, not wrong answers.
Reading a nil field panics, and we catch it. Fine.
But remember what Done() actually does: it doesn't just nil the operator, it hands the object to a different query, which fills it with its data. If the marshal reads it at that moment, there's no nil, no panic, nothing to recover. Just perfectly valid-looking JSON containing another request's plan fragments, silently emitted in your row.
Rarer than the crash, because the reuse has to land inside the window. But real. The lock would have prevented this; recover() cannot. That's the honest cost of the trade, and it belongs written down in the ticket, not carried around in someone's head.
2. A small pool leak on the recovered path.
Parallel, the container operator from part 1 that clones a child sub-plan N times, makes a temporary copy of its child when marshalling, and returns it to the pool afterwards:
outChild = this.child.Copy()
val, err := json.Marshal(r)
if outChild != nil {
    outChild.Done()          // ← skipped if we panic before reaching it
}
Panicking past that line means the copy never goes back. Bounded by how often the recovery fires, so minor, but worth writing down rather than discovering later.
3. It's one branch. The same defect exists on the newer release line, relocated into a different function. Fixing one branch is not fixing the bug.
Before and after
| Before | After | |
|---|---|---|
| What's stored for later | Raw pointer to a live tree | A wrapper holding the pointer |
| When JSON is built | Later (lazy) | Later (lazy), unchanged |
| If the tree dies first | 💥 Request aborted | "plan": null + a debug log |
| Cost to normal requests | none | None (no lock added) |
What I'd take away from this
The alert label is part of the bug. An event that means "one request was aborted" was reading as "service crashed" while the process sat on 73 days of continuous uptime. The most valuable single output of the investigation was not the patch. It was the sentence "nothing restarted, here is the uptime counter."
"There's a data race" is a description, not a verdict. The right response depends entirely on what the racing data is for. A race on user data is a correctness bug and must be eliminated. A race on best-effort telemetry might be a containment problem. I defaulted to the first framing and had to be talked out of it.
Locks aren't free, and the cost lands somewhere you're not looking. The lock version's cost wasn't complexity or risk. It was a permanent tax on every request's completion path, paid forever, to protect a page someone opens occasionally. The cost showed up in the hot path to buy safety in the cold path. That's backwards.
A shrunk critical section is often the whole design. Both the deadlock and the race were resolved by the same realization: don't lock the data, lock the decision to hand the data out. Two instructions instead of an entire teardown. That's the difference between "correct but deadlocks" and "correct."
Review challenges are worth answering in full even when they're wrong. The senior engineer's timeline described a scenario that couldn't happen. Working through why it couldn't happen is what surfaced the unguarded SetTimings(), a genuine second bug in a completely different place.
Reverts need the same scrutiny as the original. A commit fixing a rendering bug reintroduced a use-after-free that had been fixed nine days earlier, and nothing anywhere flagged that the code being reverted was load-bearing. I don't have a clean answer for this one. But if you're reverting a fix, it's worth at least reading what it was fixing.
Tools that observe a running system are part of that system. The moment your monitoring reaches into live state instead of a snapshot, it stops being a passive observer and becomes another concurrent actor, with all the ordering hazards that implies. Worth remembering the next time you build an admin page.